Plotting
The plotting interface is fluent, meaning that the graphical content of the plot is configured by a chain of method calls. Steps along this chain (including the Hist itself) are PlottingChain objects and the last one is Plotable1d or Plotable2d.
-
class
histbook.vega.PlottingChain(source, item)¶ Mix-in for
Hist(as the first in a plotting chain) andChannelsin a plotting chain.-
area(axis=None, profile=None, error=False, normalized=False, width=None, height=None, title=None, config=None, xscale=None, yscale=None, colorscale=None, shapescale=None)¶ Display bins in
axis(if not the only axis) as areas on the horizontal axis.Parameters: - axis (
None,Axis, algebraic expression (lambda or string), or index position (integer)) – the axis to overlay; ifNone(default), use the only axis in thisHist - profile (
None,profile, algebraic expression (lambda or string) or index position (integer)) – ifNone(default), display bin counts; otherwise, display profile means (and errors on the mean) - error (bool) – if
True, overlay error bars - normalized (bool) – if
True, normalize the histogram - height, title, config, xscale, yscale, colorscale, shapescale (width,) – graphical directives to pass to Vega-Lite
Returns: Return type: - axis (
-
bar(axis=None, profile=None, error=False, normalized=False, width=None, height=None, title=None, config=None, xscale=None, yscale=None, colorscale=None, shapescale=None)¶ Display bins in
axis(if not the only axis) as bars on the horizontal axis.Parameters: - axis (
None,Axis, algebraic expression (lambda or string), or index position (integer)) – the axis to overlay; ifNone(default), use the only axis in thisHist - profile (
None,profile, algebraic expression (lambda or string) or index position (integer)) – ifNone(default), display bin counts; otherwise, display profile means (and errors on the mean) - error (bool) – if
True, overlay error bars - normalized (bool) – if
True, normalize the histogram - height, title, config, xscale, yscale, colorscale, shapescale (width,) – graphical directives to pass to Vega-Lite
Returns: Return type: - axis (
-
below(axis)¶ Display bins in
axisnext to each other vertically.Parameters: axis ( Axis, algebraic expression (lambda or string), or index position (integer)) – the axis to overlayReturns: Return type: PlottingChain
-
beside(axis)¶ Display bins in
axisnext to each other horizontally.Parameters: axis ( Axis, algebraic expression (lambda or string), or index position (integer)) – the axis to overlayReturns: Return type: PlottingChain
-
heatmap(xaxis=None, yaxis=None, profile=None, width=None, height=None, title=None, config=None, xscale=None, yscale=None, colorscale=None)¶ Display bins in
xaxisandyaxis(if not the only two axes) as a heatmap.Parameters: - xaxis (
None,Axis, algebraic expression (lambda or string), or index position (integer)) – the horizontal axis to overlay; ifNone(default), use the first of the only two axes in thisHist - yaxis (
None,Axis, algebraic expression (lambda or string), or index position (integer)) – the vertical axis to overlay; ifNone(default), use the second of the only two axes in thisHist - profile (
None,profile, algebraic expression (lambda or string) or index position (integer)) – ifNone(default), display bin counts; otherwise, display profile means (and errors on the mean) - height, title, config, xscale, yscale, colorscale (width,) – graphical directives to pass to Vega-Lite
Returns: Return type: - xaxis (
-
line(axis=None, profile=None, error=False, normalized=False, width=None, height=None, title=None, config=None, xscale=None, yscale=None, colorscale=None, shapescale=None)¶ Display bins in
axis(if not the only axis) as lines on the horizontal axis.Parameters: - axis (
None,Axis, algebraic expression (lambda or string), or index position (integer)) – the axis to overlay; ifNone(default), use the only axis in thisHist - profile (
None,profile, algebraic expression (lambda or string) or index position (integer)) – ifNone(default), display bin counts; otherwise, display profile means (and errors on the mean) - error (bool) – if
True, overlay error bars - normalized (bool) – if
True, normalize the histogram - height, title, config, xscale, yscale, colorscale, shapescale (width,) – graphical directives to pass to Vega-Lite
Returns: Return type: - axis (
-
marker(axis=None, profile=None, error=True, normalized=False, width=None, height=None, title=None, config=None, xscale=None, yscale=None, colorscale=None, shapescale=None)¶ Display bins in
axis(if not the only axis) as markers on the horizontal axis.Parameters: - axis (
None,Axis, algebraic expression (lambda or string), or index position (integer)) – the axis to overlay; ifNone(default), use the only axis in thisHist - profile (
None,profile, algebraic expression (lambda or string) or index position (integer)) – ifNone(default), display bin counts; otherwise, display profile means (and errors on the mean) - error (bool) – if
True, overlay error bars - normalized (bool) – if
True, normalize the histogram - height, title, config, xscale, yscale, colorscale, shapescale (width,) – graphical directives to pass to Vega-Lite
Returns: Return type: - axis (
-
overlay(axis)¶ Display bins in
axisoverlaid on each other in different colors.Parameters: axis ( Axis, algebraic expression (lambda or string), or index position (integer)) – the axis to overlayReturns: Return type: PlottingChain
-
stack(axis, order=None)¶ Display bins in
axisstacked on one another in an area plot.Parameters: - axis (
Axis, algebraic expression (lambda or string), or index position (integer)) – the axis to overlay - order (iterable of strings) – stacking order of bins
Returns: Return type: - axis (
-
step(axis=None, profile=None, error=False, normalized=False, width=None, height=None, title=None, config=None, xscale=None, yscale=None, colorscale=None, shapescale=None)¶ Display bins in
axis(if not the only axis) as steps on the horizontal axis.Parameters: - axis (
None,Axis, algebraic expression (lambda or string), or index position (integer)) – the axis to overlay; ifNone(default), use the only axis in thisHist - profile (
None,profile, algebraic expression (lambda or string) or index position (integer)) – ifNone(default), display bin counts; otherwise, display profile means (and errors on the mean) - error (bool) – if
True, overlay error bars - normalized (bool) – if
True, normalize the histogram - height, title, config, xscale, yscale, colorscale, shapescale (width,) – graphical directives to pass to Vega-Lite
Returns: Return type: - axis (
-
-
class
histbook.vega.Plotable1d(source, item)¶ Mix-in for
ChannelsandCombinationsthat can be plotted.-
altair(validate=True)¶ Return an altair.Chart of this plot using the Altair library.
-
ipyvega()¶ Draw this plot inline in a Jupyter notebook (not lab) using the vega library.
-
to(fcn)¶ Call
fcnon the Vega-Lite JSON for this plot.
-
vegalite()¶ Return the Vega-Lite JSON for this plot.
-
vegascope(canvas=None)¶ Draw this plot in a (possibly remote) browser using the VegaScope library.
-
-
class
histbook.vega.Plotable2d(source, item)¶ Mix-in for
ChannelsandCombinationsthat can be plotted.-
altair(validate=True)¶ Return an altair.Chart of this plot using the Altair library.
-
ipyvega()¶ Draw this plot inline in a Jupyter notebook (not lab) using the vega library.
-
to(fcn)¶ Call
fcnon the Vega-Lite JSON for this plot.
-
vegalite()¶ Return the Vega-Lite JSON for this plot.
-
vegascope(canvas=None)¶ Draw this plot in a (possibly remote) browser using the VegaScope library.
-
-
class
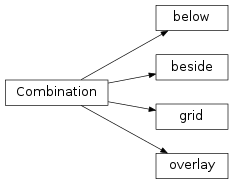
histbook.vega.Combination(plotables, types, opts)¶ Abstract class for
Plotable1dsthat have been combined as an overlay or side-by-side plots.-
altair(validate=True)¶ Return an altair.Chart of this plot using the Altair library.
-
ipyvega()¶ Draw this plot inline in a Jupyter notebook (not lab) using the vega library.
-
to(fcn)¶ Call
fcnon the Vega-Lite JSON for this plot.
-
vegascope(canvas=None)¶ Draw this plot in a (possibly remote) browser using the VegaScope library.
-
-
class
histbook.vega.overlay(*plotables, **opts)¶ Plotable1doverlaying two or more independently producedPlotable1ds.-
altair(validate=True)¶ Return an altair.Chart of this plot using the Altair library.
-
ipyvega()¶ Draw this plot inline in a Jupyter notebook (not lab) using the vega library.
-
to(fcn)¶ Call
fcnon the Vega-Lite JSON for this plot.
-
vegascope(canvas=None)¶ Draw this plot in a (possibly remote) browser using the VegaScope library.
-
-
class
histbook.vega.beside(*plotables, **opts)¶ Plotable1ddisplaying two or more independently producedPlotable1dsbeside each other horizontally.-
altair(validate=True)¶ Return an altair.Chart of this plot using the Altair library.
-
ipyvega()¶ Draw this plot inline in a Jupyter notebook (not lab) using the vega library.
-
to(fcn)¶ Call
fcnon the Vega-Lite JSON for this plot.
-
vegascope(canvas=None)¶ Draw this plot in a (possibly remote) browser using the VegaScope library.
-
-
class
histbook.vega.below(*plotables, **opts)¶ Plotable1ddisplaying two or more independently producedPlotable1dsbelow each other vertically.-
altair(validate=True)¶ Return an altair.Chart of this plot using the Altair library.
-
ipyvega()¶ Draw this plot inline in a Jupyter notebook (not lab) using the vega library.
-
to(fcn)¶ Call
fcnon the Vega-Lite JSON for this plot.
-
vegascope(canvas=None)¶ Draw this plot in a (possibly remote) browser using the VegaScope library.
-
-
class
histbook.vega.grid(numcol, *plotables, **opts)¶ Plotable1ddisplaying two or more independently producedPlotable1dsin a rectangular grid of numcol columns.-
altair(validate=True)¶ Return an altair.Chart of this plot using the Altair library.
-
ipyvega()¶ Draw this plot inline in a Jupyter notebook (not lab) using the vega library.
-
to(fcn)¶ Call
fcnon the Vega-Lite JSON for this plot.
-
vegascope(canvas=None)¶ Draw this plot in a (possibly remote) browser using the VegaScope library.
-